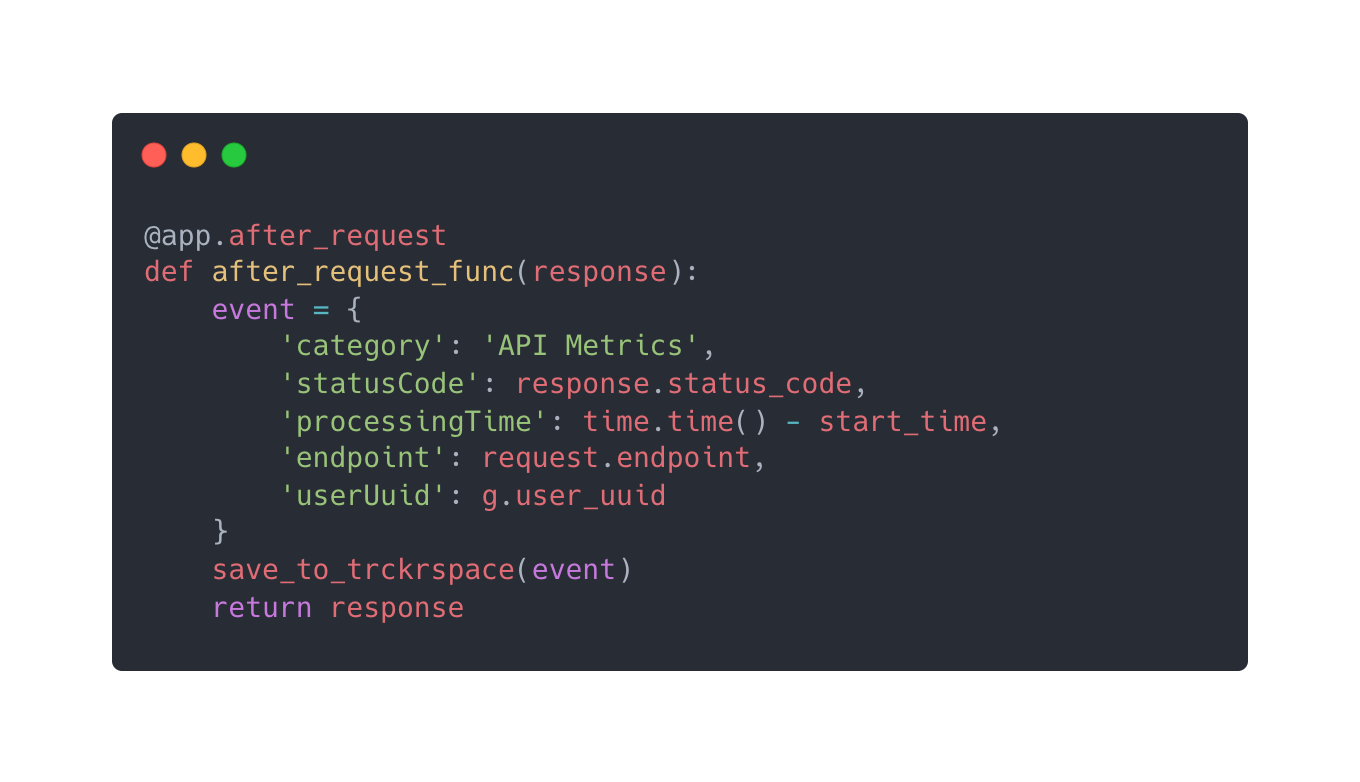
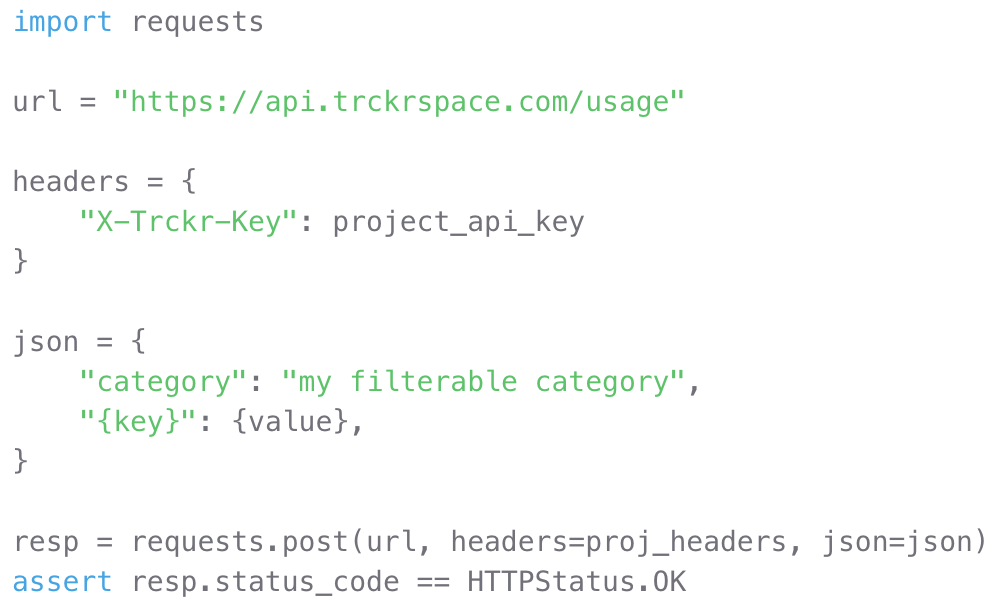
After each API request you can collect your metrics and add a step to save the event to trckspace. Trckrspace lets you put any number of JSON serializable key-values into your events, meaning you can save any data you need.
Add a "category" to later filter the data in your custom dashboards.
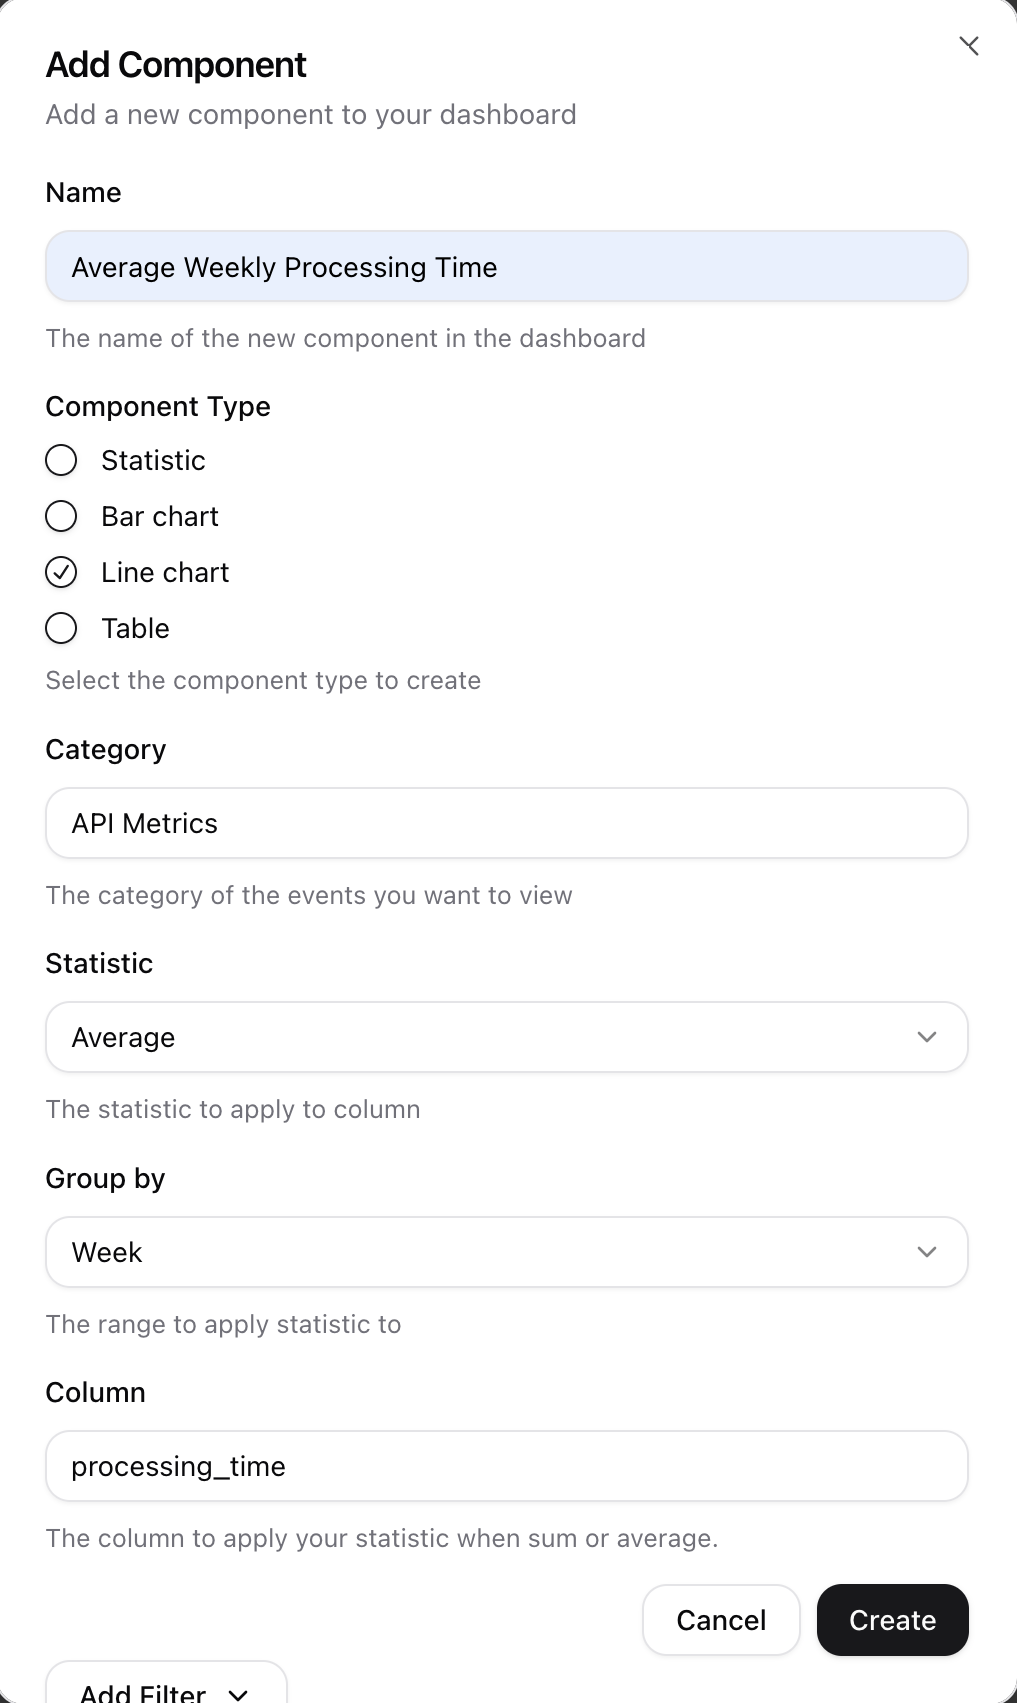
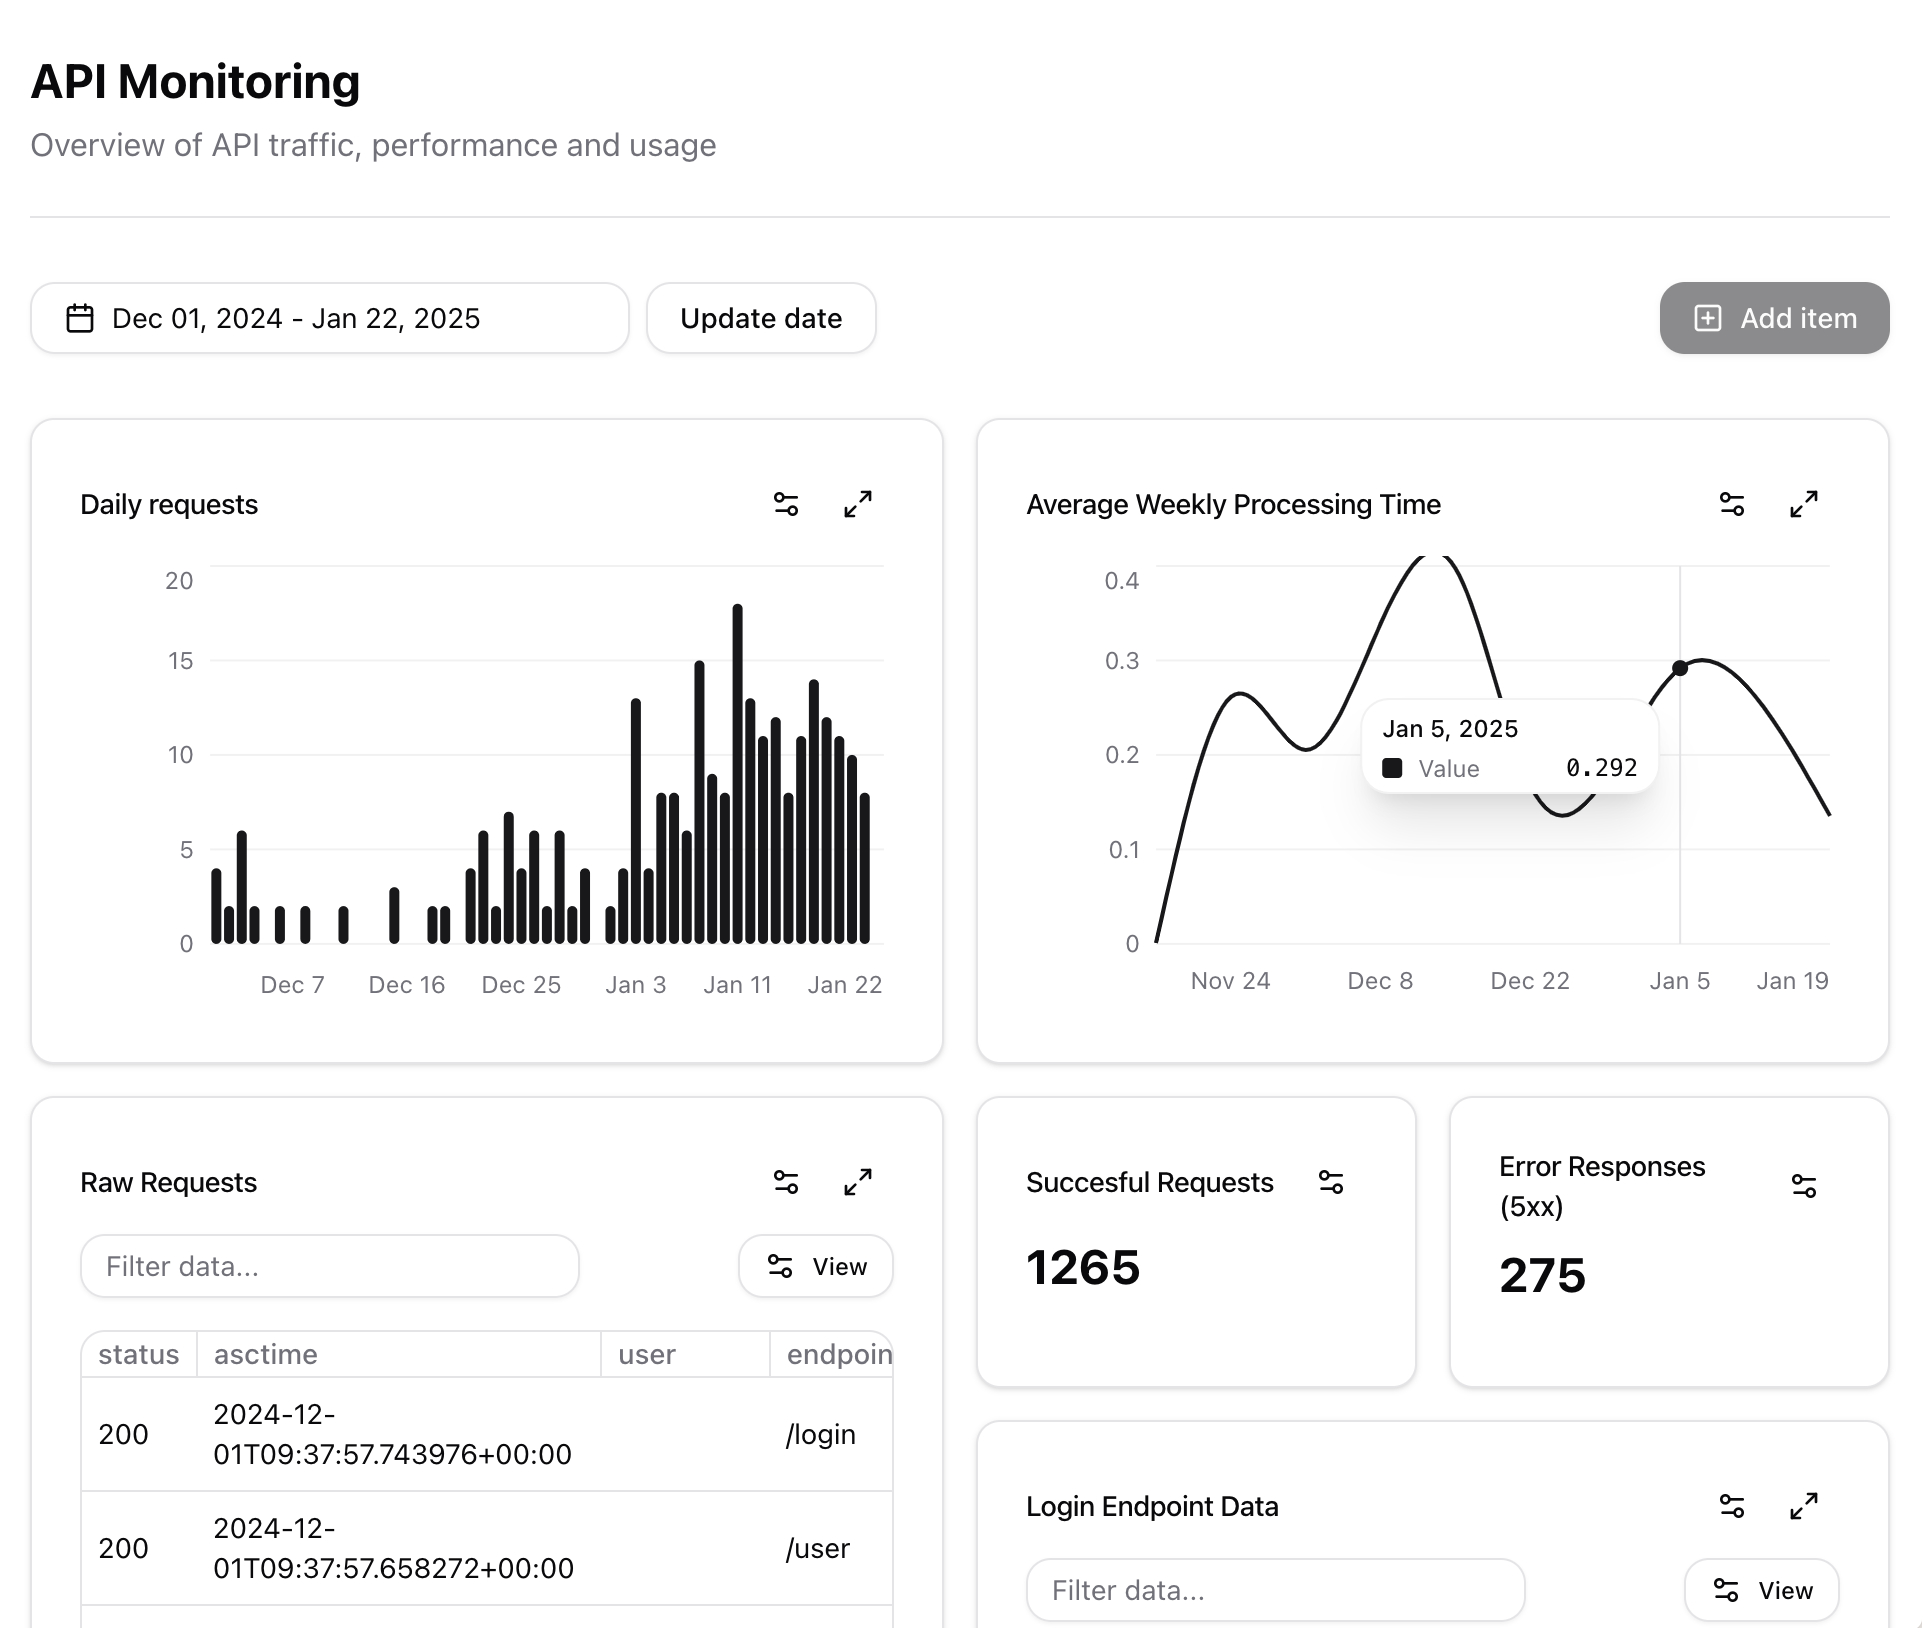
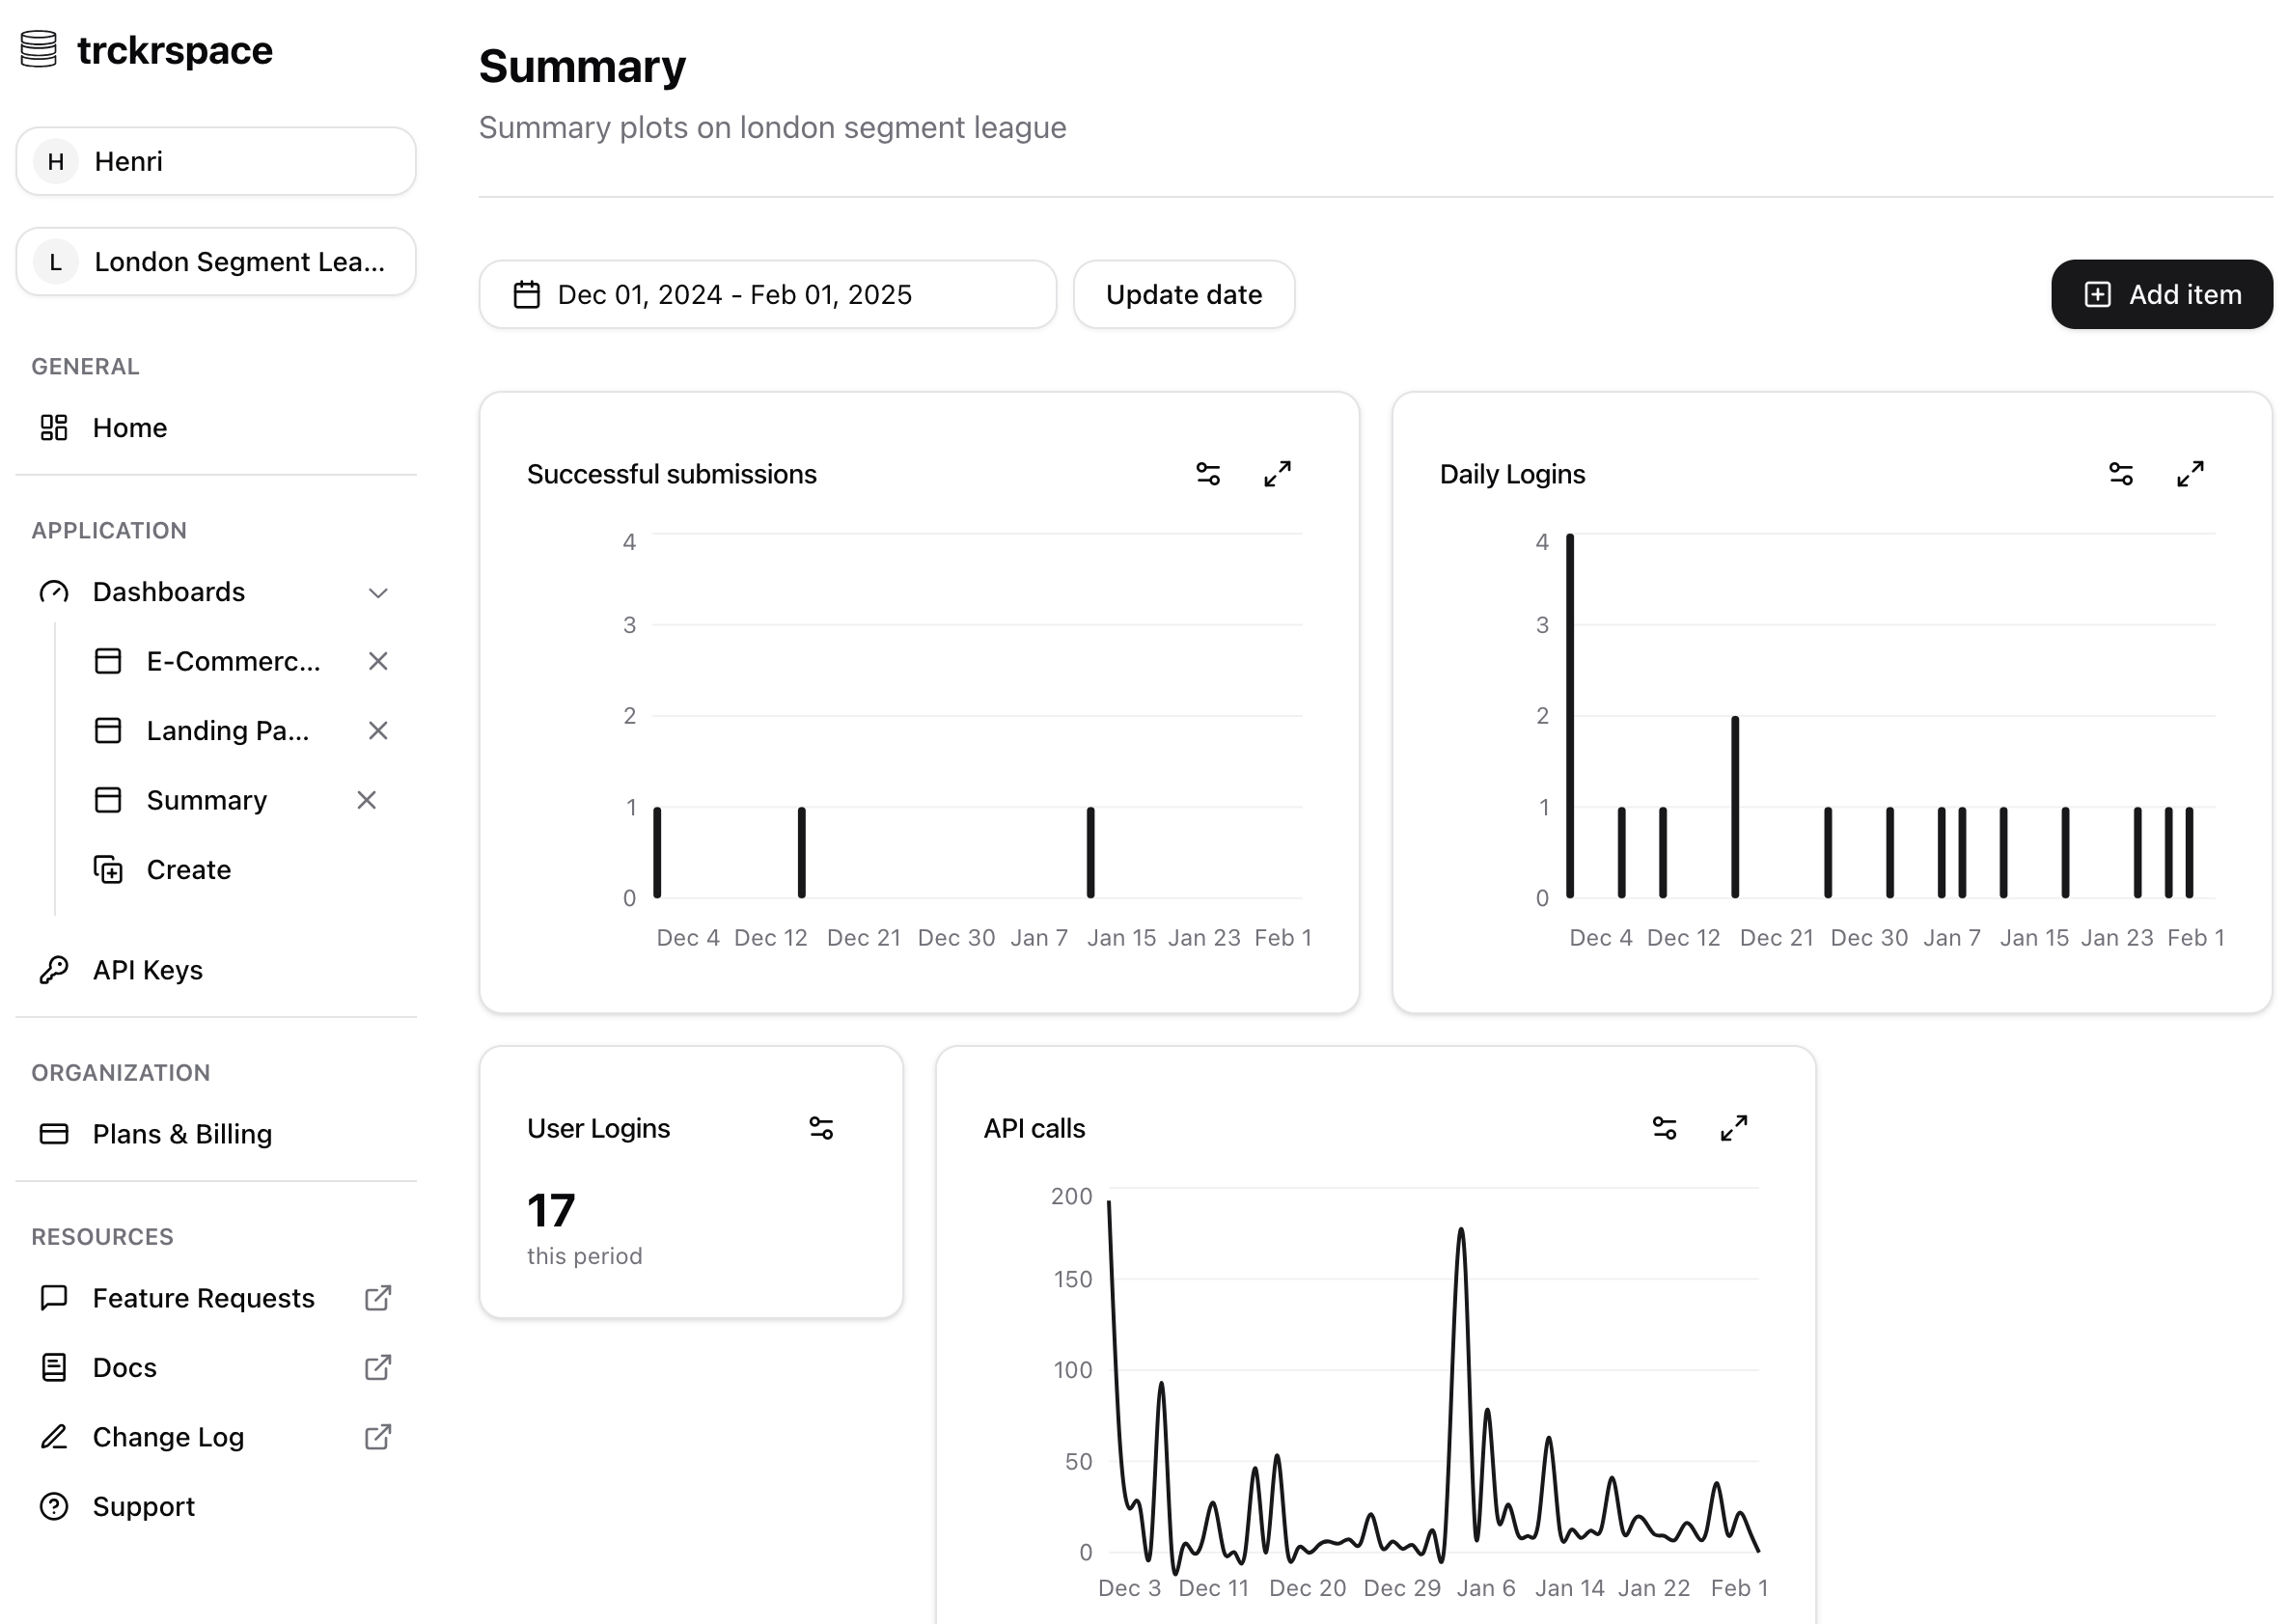
Add a new component to your trckrspace dashboard with the same category. Trckrspace supports many different components, from plain statistics to line charts.
You can further filter your data on any of key-values added in your event.
You can calculate aggregations (min, max, average and more) by using the functions provided and aggregate over different periods to see how your API performance changes over time.
This flexibility allows you to build any dashboard you need no matter the shape or size of the data.
View your dashboard and see your data in real-time.
Prefer learning by example? See the below examples for API Analytics