Monitor your Flask API
When developing an API, we always want to know how our API is performing for all our customers. Monitoring your API is crucial to ensure it's current performance and reliability. However setting up the infrastructure to do this can be tedious and often we result to performing queries on logs.
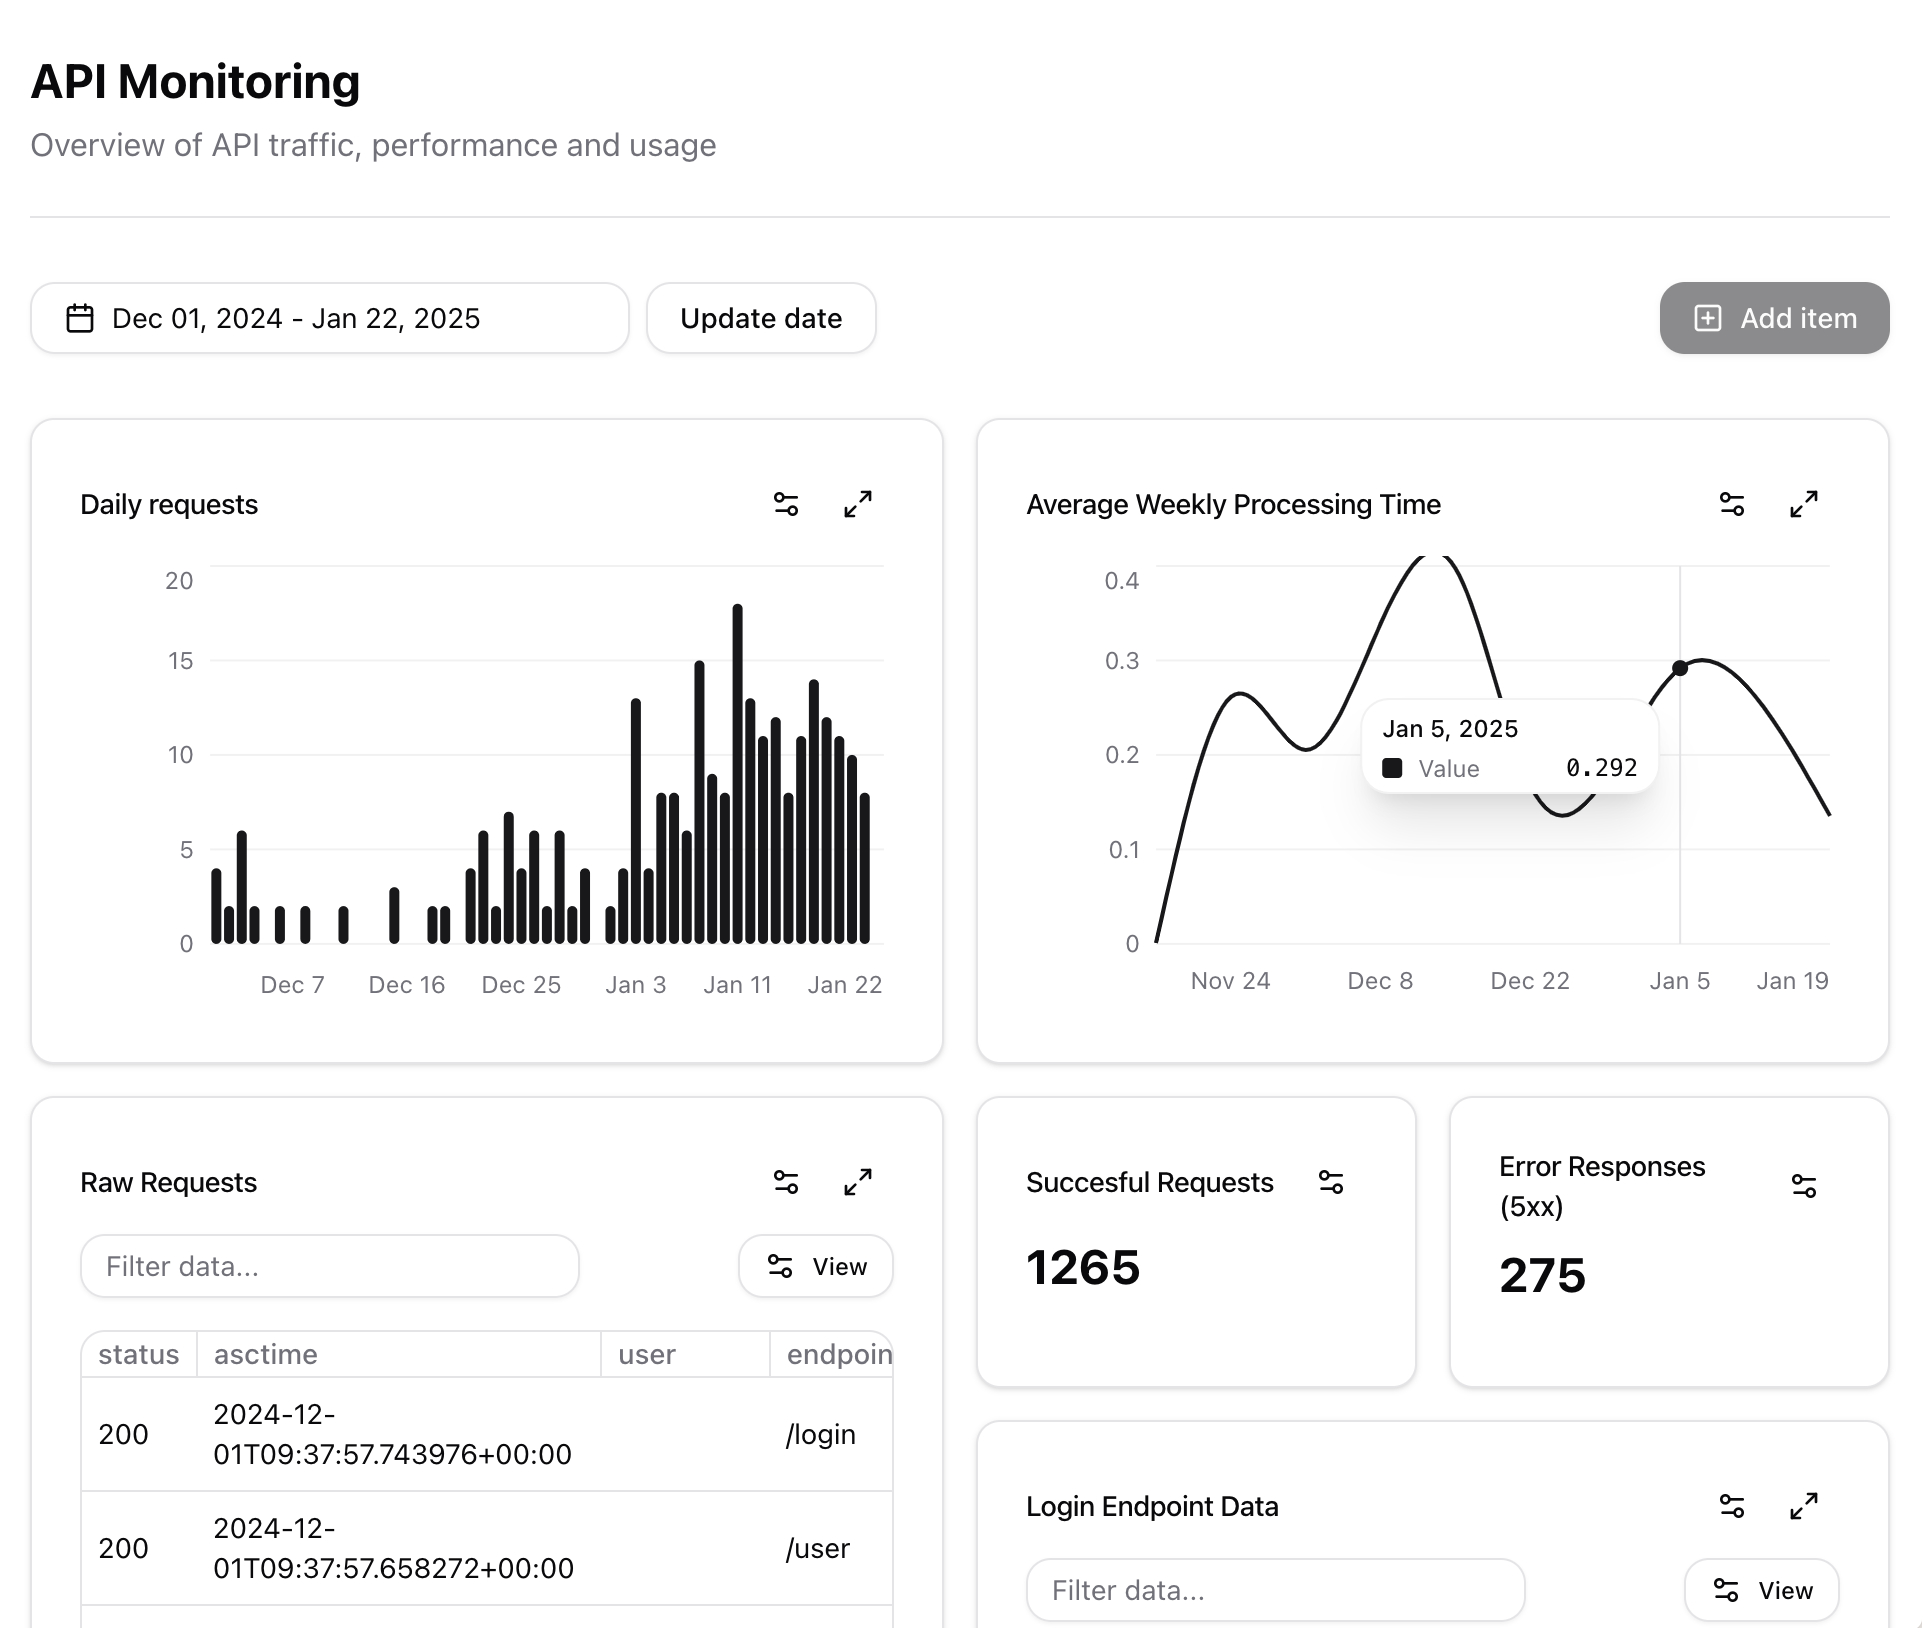
Most of the time we just want to know at a high-level the current status. This could be:
- Average and maximum processing time today, this week or over a month
- Number of 5xx status codes
- Current CPU or memory utilization
Trckrspace can help you solve this problem by providing a service for you to store metrics about your own API. Trckrspace is easy to integrate with your current setup and can remove the need for building a custom solution by providing users with interactive custom dashboards.
To follow along with this guide, first create a trckrspace account by clicking here.
Getting setup
- Log into your dashboard at clicking here.
- Create an API key - you can find more info in the quick start guide by clicking here
Tutorial
In flask there is a callback called after_request, we can utilse this feature
to make a call to trckrspace after every request with all the metrics we want
to monitor.
Here's how to do this:
import os

from flask import request, g
import requests


def save_event(event: dict):
    api_key = os.environ['trckrspace_api_key']
    headers = {X-Api-Key': api_key}

    requests.post(
        'https://api.trckrspace.com/usage', headers=headers, json=event
    )
    return None


@app.after_request
def after_request_func(response):
    start_time = g.start_time
    user_uuid = g.user_uuid
    event = {
        'status_code': response.status_code,
        'endpoint': request.url,
        'processing_time': time.time() - start_time,
        'user_uuid': user_uuid,
    }
    save_event(event)
    return response
Viewing Data
To view your data log back into the trckrspace dashboard and create a new dashboard.
You can filter components on the dashboard by category and any other
key-value pairs, for example here status_code=200. After that you can
aggregate your data by or just see the raw events.
Following the getting started guide to learn more.
Summary
This guide showed you how easy it is to integrate trckrspace to monitor your flask API. As well as API monitoring, trckrspace can be used for many more use-cases. Checkout more examples or signup for free now to try it out yourself.